Contents
- 1 Top 100 Giants 2024
- 2 Firms with the Most Fee Growth (in millions)
- 3 Top Ten Giants by Sector
- 4 Office
- 5 Retail
- 6 Government
- 7 Education
- 8 Cultural and Sports Centers
- 9 Transportation
- 10 Senior Living
- 11 Residential
- 12 Client Issues
- 13 Practice Issues
- 14 Business Issues
- 15 Staffing Information
- 16 Firm Employees
- 17 Billable Time
- 18 Project Categories
- 19 Segment Income
- 20 International Project Locations
- 21 Project Locations
For the first time ever, the top 100 Giants’s interior design fees surpassed the $5 billion mark—and almost zoomed right past $6B! These are record-breaking tallies for our most profitable firms and a year-over-year boost of almost 19 percent.
Looking at sector change over the last five years gives us a more nuanced view of the economic picture. The industry was on a pretty steady upward trajectory until 2020, so we look at 2019 as the marker for recovery. Corporate—always the biggest money-maker for these leaders—is still down 13 percent since prepandemic days, but up 10 percent in the last year.
Top 100 Giants 2024
Note: Firms on this list do the majority of their work overseas and/or are headquartered outside the U.S.
“blank cells” = did not report data
Hospitality, currently experiencing the slowest rebound, is down 21 percent from five years ago. The other blip is residential, down 9 percent since the 2019 high, but fees have been growing slowly every year since that initial COVID drop-off. Surprisingly, 100 Giants experienced strong double-digit growth in every other sector we track. Since 2019, government is up 89 percent, healthcare 55 percent, and education 35 percent. To put things in context, some of those surging sectors account for small dollar amounts overall—education is a $391 million vertical compared to corporate’s $1.6B—but these are big percentages nonetheless. They’re also evidence of the Giants diversifying into markets where business is comparatively booming to offset their declining corporate or hospitality fees.
Projects are way up, to more than 80K, blowing past 2019 levels. Also upticking, and significantly so, is the furniture, fixtures, and construction value of work installed—aka FF&C—to the tune of 25 percent year-over-year. Some of that growth is surely attributable to price increases, but inflation can’t account for the full boost. A particularly interesting metric is the ratio of furniture-and-fixtures dollars to construction dollars. The data has made a notable shift toward F&F since 2019, and this year’s 45/55 split is the highest it’s been. Not a huge surprise, perhaps, given the well-documented construction slowdown we’re experiencing, but noteworthy in that 2023 clearly solidified the “rise of refresh” our ThinkLab friends have been observing and predicting for a while.
Stay tuned as we unveil more Giants of Design this spring, including Sustainability, Rising, Hospitality, and Healthcare Giants.
Against this backdrop of upswings, other metrics remain stable. Growth locations are unchanged: Domestically, the south predominates, while overseas growth is primarily concentrated in Europe, Asia, and Canada. There was also little movement in satellite office openings/closures, and only 15 percent of firms are planning to launch new locations in 2024, defying our predictions of more prevalent post-pandemic reapportioning.
Staffing has experienced some positive flux, with design-employee rosters zipping past 2019 levels. In fact, the 100 Giants have seen a huge 90 percent increase in the amount of principals and partners over the past five years, a figure that includes both new hires and promotions. Interestingly, the total number of employees—encompassing both designers and supplemental staffers such as admin and HR—has declined 16 percent over the half-decade, likely due to the latter positions being eliminated.
International Giants 2024
Note: Firms based outside the U.S. who don’t operate a North American office and/or generate less than 25 percent of interior design fee income in North America are ranked here instead of in the main listings.
“blank cells” = did not report data
Billing rates usually track around 80 percent for all design staff. In 2023, those rates were flat for partners, up for project managers, and down for designers, who are perhaps absorbing some of the downsized admin staff’s nonbillable duties. Yet salaries have increased across the board, an average of 25 percent, since 2019. This likely signals a salary correction following a few years of slimmed-down staff absorbing extra work without additional compensation, and/or Giants having to pay their employees a bit more to stay competitive.
Speaking to that issue, the 100 Giants reported that the biggest practice-related challenge remains recruiting qualified staff. (You wouldn’t know that by reading ThinkLab’s U.S. Design Industry Benchmark Report, which found that 41 percent of designers employed at firms work at one of the top 200 companies. So, the bigs are getting bigger and boast more hiring power than ever!) The most pervasive challenge vis-à-vis clients? That’s remained the same since last year, too: getting them to understand the value of design and paying what it’s worth. The Giants noted that clients’ appetite for design services has gone down over the last 12 months.
Overall, these metrics add up great news for the top 100 and for the industry as a whole. The Giants are experiencing recovery at long last. But will that recovery last? Firms remain cautious about the future, predicting a mild decline for 2024, which is expected given that the biggest business challenge remains the uncertain economy. Yet the all-around optimistic data suggests that next year at this time we’ll be looking back at a strong 2024.
Editor’s Note: Take a look at recent coverage of our Top 100 Giants most admired firms of 2023 below. Gensler tops the list followed by Rockwell Group, Perkins&Will, AvroKo, and Yabu Pushelberg.
Read More About Gensler
Firms with the Most Fee Growth (in millions)
Top Ten Giants by Sector
Office
Retail
Government
Education
Cultural and Sports Centers
Transportation
Senior Living
Residential
Note: * = new to Top 10. Hospitality and Healthcare rankings are featured in their own listings.
All dollar amounts are in millions.
Read More About Rockwell Group
Client Issues
Practice Issues
Business Issues
Read More About Perkins&Will
Staffing Information
Firm Employees
Billable Time
Project Categories
Read More About AvroKo
Segment Income
International Project Locations
Project Locations
Read More About Yabu Pushelberg
-

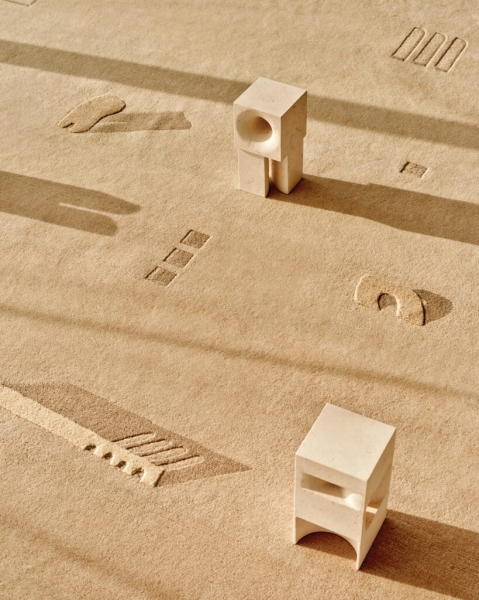
Yabu Pushelberg Designs a Surrealist Rug Collection for CC-Tapis
-

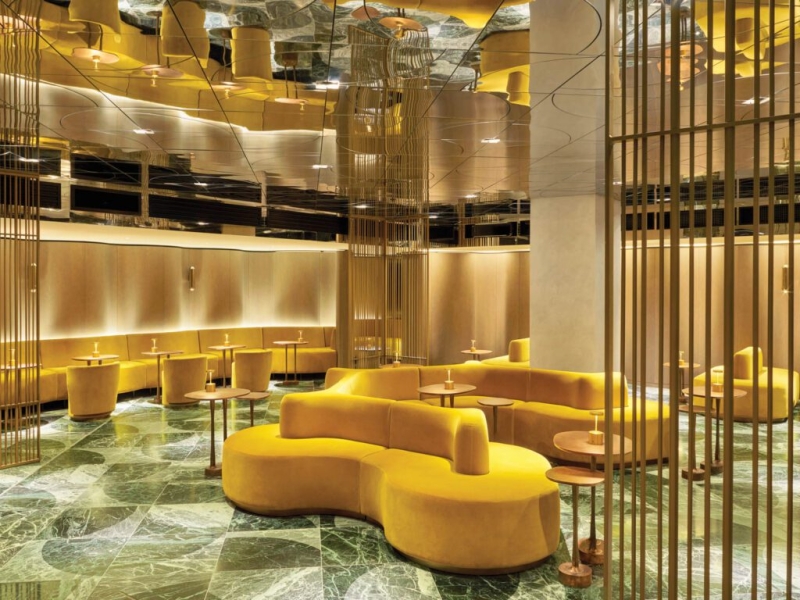
George Yabu and Glenn Pushelberg Design a Dramatic Hotel in Leicester Square
-

George Yabu and Glenn Pushelberg Earn a Best of Year Award for This Chic Parisian Store
Methodology
The Interior Design Giants of Design annual business survey comprises the largest firms ranked by interior design fees for the 12-month period ending December 31, 2023. The listings are generated from only those surveyed. To be recognized as a top 100, Rising, Healthcare, Hospitality, or Sustainability Giant, you must meet the following criteria: Have at least one office location in North America and generate at least 25 percent of your interior design fee income in North America. Firms that do not meet the criteria are ranked on our International Giants list. Interior design fees include those attributed to:
1. All aspects of a firm’s interior design practice, from strategic planning and programming to design and project management.
2. Fees paid to a firm for work performed by employees and independent contractors who are “full-time staff equivalent.”
Interior design fees do not include revenues paid to a firm and remitted to subcontractors who are not considered full-time staff equivalent. For example, certain firms attract work that is subcontracted to a local firm. The originating firm may collect all the fees and retain a management or generation fee, paying the remainder to the performing firm. The amounts paid to the latter are not included in fees of the collecting firm when determining its ranking. Ties are broken by rank from last year. Where applicable, all percent ages are based on responding Giants, not their total number.
All research conducted by ThinkLab, the research division of SANDOW Design Group.

